We need to look at the past, to see where we are and where are going! Real Estate trends and statistics are important, recent historical data can give us important insights into what is currently happening and what is going to happen soon.
For REALTORS® in the East & West Kootenays the tail end of 2019 and beginning of 2020 represented some big changes in our real estate database and technology we use on a daily basis- with this change comes a learning curve but also some powerful new tools to be able to track and report on market trends and activity. The change also means that the format and comparison my brokerage would normally produce for real estate statistics (breaking things down by community and property type) can't be as easily replicated in the same format- at least not yet.
The highlights?
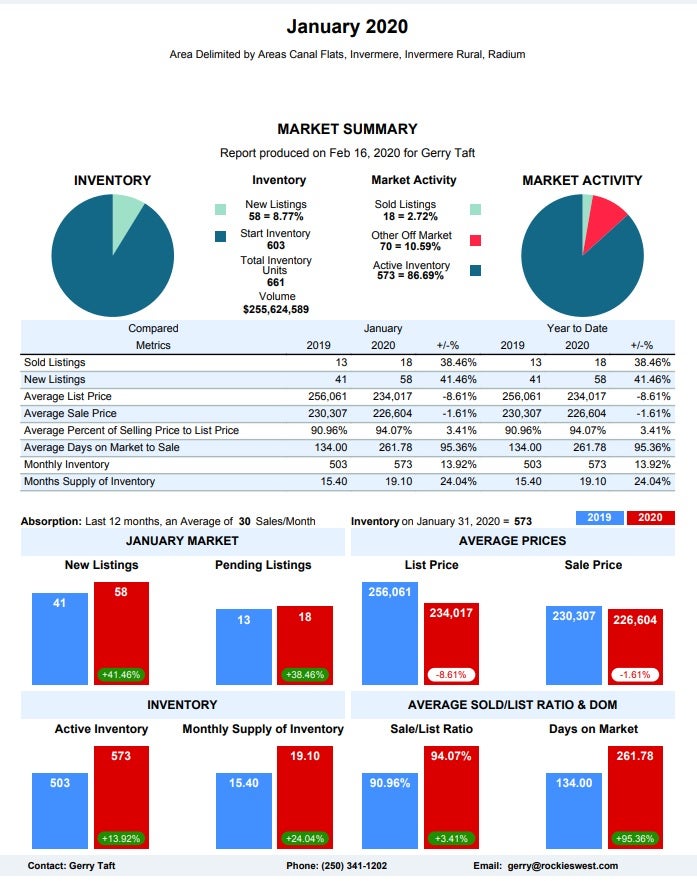
In 2019 Total number of units sold (all property types and all communities between Canal Flats to Spillimacheen):
- 355 (in 2018 it was 402, in 2017 it was 417)
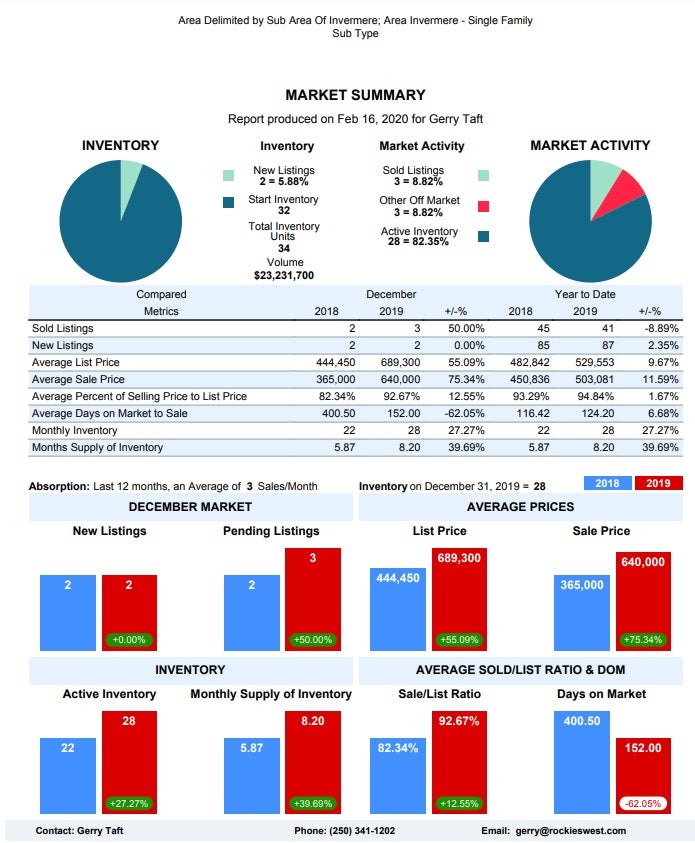
Zooming into a more specific category, single family homes in Invermere in 2019?
- 41 single family homes sold in Invermere 2019 (it was 45 in 2018)
- Average selling price was $503,081 in 2019 (in 2018 it was $450,836)
- Selling price to list price ratio was 94.84% in 2019 (in 2018 it was 93.29%)
So far in 2019 what is happening?
- January 2020 there have been 18 sales throughout the valley (compared with 13 in 2019)
- In January 2020 there were 58 new listings (compared with 41 in 2019)
Conclusion
Considering the time of year there seems to be a strong level of interest in properties in the valley. There seems to be a some keen interest in seeing new listings and new inventory added to the market and there are a number of buyers who seem ready to move on homes that are in good condition and priced reasonably. Generally, there doesn't seem to be any huge increase in sale prices, but demand remains strong.